
Ever wonder what you're actually buying when you pay your taxes? (2025 edition)
💵Use our calculator to create a personalized summary + 🎵 playlists for tax-prep

In the US, federal income taxes are due Tuesday, April 15. If you’ve already filed, good for you. Many others — yours truly included — will be spending some of this weekend working on taxes (how to file for an extension).
If you’re among the 43% of my readers who are outside the US, this would be a great week to catch up on any issues you may have missed in the archive or check out one of the most popular issues. You may also find the issue below of interest, too.
This week’s issue is based on one I wrote a year ago this week. I have updated both the copy and the calculator to reflect the current 2025 budget and also highlighted a few notable changes in our nation’s budget priorities year-over-year.
If you’re not yet a subscriber or supporter, you can become one here:

I’ve often wondered if people would feel better about paying taxes if it was more apparent what you are buying with your hard-earned money. You know, kind of like a nutrition label.
As it happens, Visual Capitalist published this visual in 2024:

It’s great for seeing the relative proportions of various government services, but what I’ve always wanted is a customized invoice that says: here’s what your taxes are paying for this year.
So I set out to build one for us in 2024 and have updated it for 2025.
First, I had to track down the federal budget1:
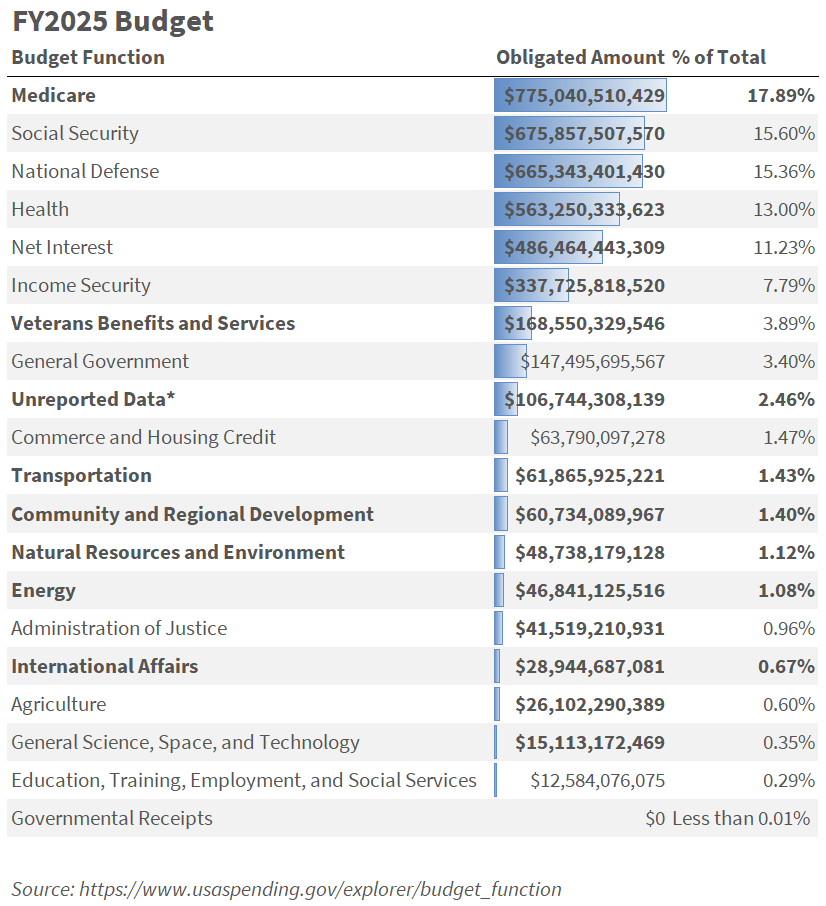
Bold reflects areas where the budget has increased year-over-year from 2024. Specifically, an item appears in bold when:
a line item has moved up in its relative position in the budget
obligated amounts that have increased from last year
% of total that has increased from last year
As I was updating this table, a few changes in spending priorities from FY2024 to FY2025 stood out:
Medicare increased 27% to overtake Social Security as the largest single budget line item (it was #2 last year; Social Security, previously #1, increased 7%).
National defense increased 13%.
Unreported Data2, which is essentially a plug, doubled.
Transportation increased 47%.
Community and Regional Development increased 101%, moving from 15th to 12th priority.
Energy increased 328%, increasing from 19th to 14th priority.
International Affairs increased 31%.
Commerce and Housing Credit decreased 38%.
Education, Training, Employment, and Social Services decreased 72%, falling from 11th to 19th priority.
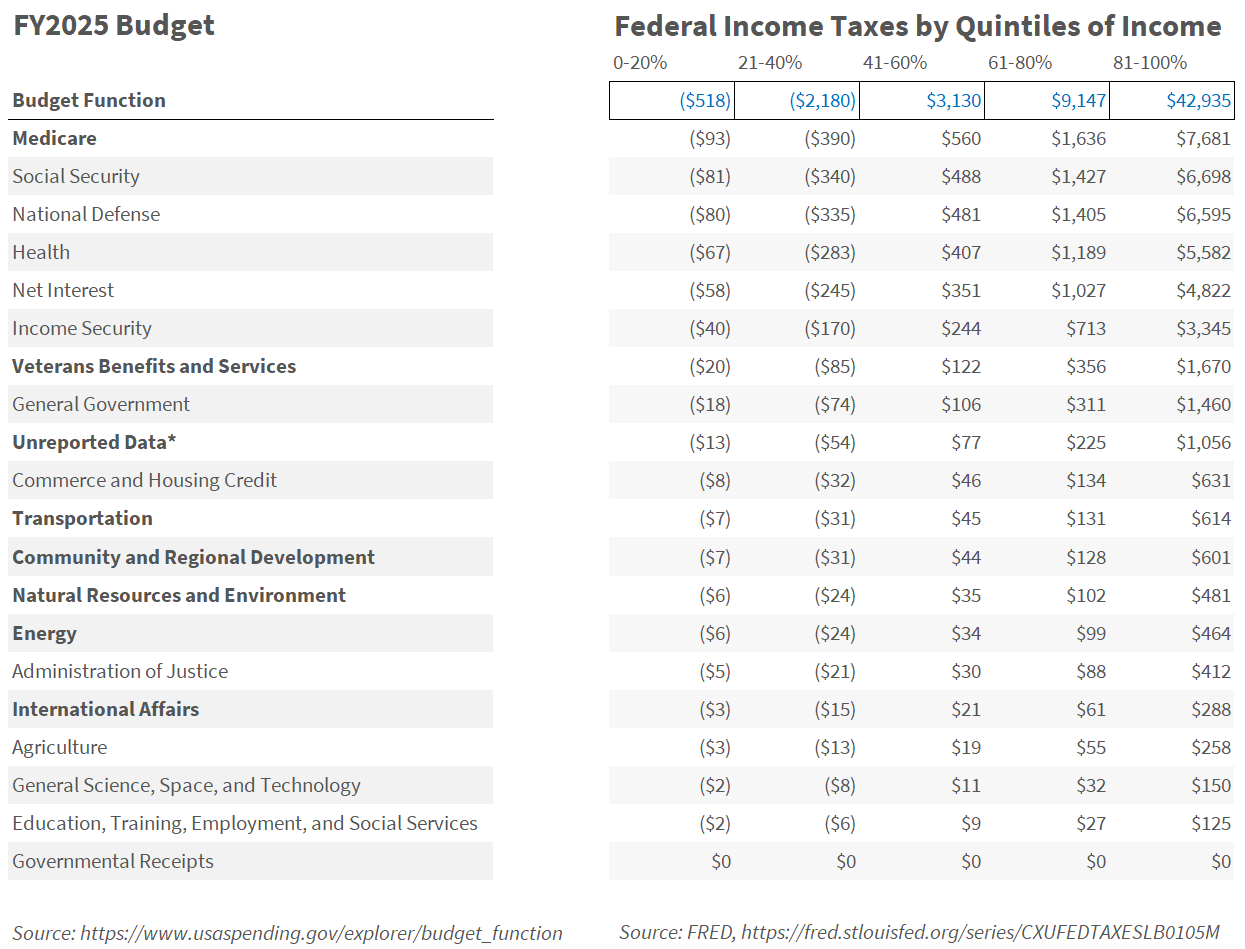
Next, I tracked down the federal income taxes paid from FRED (St. Louis Federal Reserve) for each income quintile (lowest 20%, 21-40%, 41-60%, 61-80%, and highest 20%) and created this table, updated for 2025.
Finally, I updated the quick calculator in Excel I created last year that you can use to create a personalized summary of what you are buying with your taxes this year. Here is what it looks like (using the real median household income in 2023):
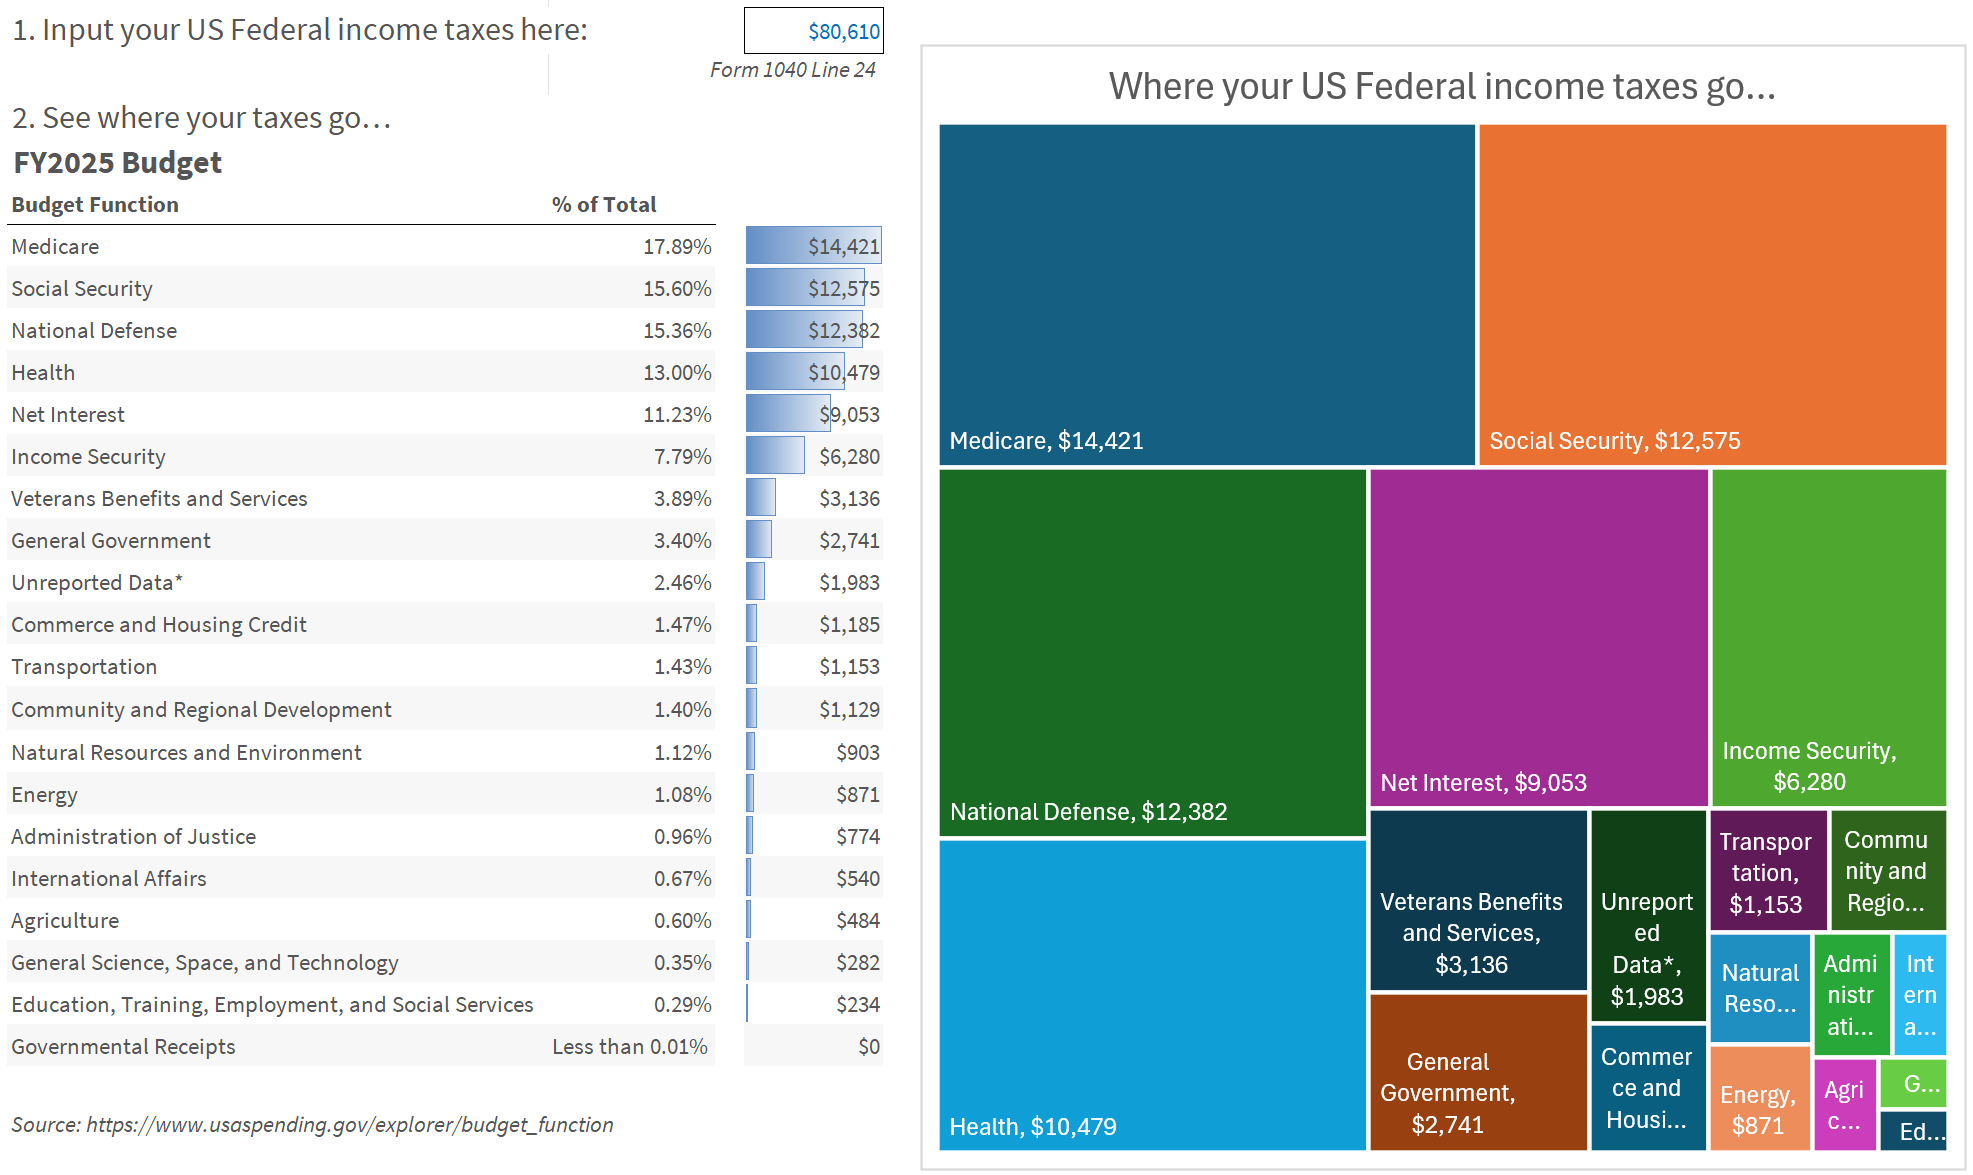
You can access it and easily create your own personalized summary here:
I hope you find this helpful. If you did, please feel free to share with others who might appreciate this attempt at a more user-centered approach to tax bills. (I’d like to do more, much more, but taxes call so that will have to wait for another day…)
I welcome any feedback you may have and, together, maybe we can start a movement towards government providing a clear accounting of the services we individually and collectively use and support.
🎵Media Embed: Music for Taxes
If you’re going to be spending some quality time with TurboTax or reviewing what your CPA prepared, I’ve got a soundtrack for you this weekend.
Here is the playlist your CPA might be listening to this weekend (it’s published by none other than the American Institute of Certified Public Accountants (AICPA)):
If you’re preparing your own taxes, here’s a Spotify playlist for you:
Apple Music has a playlist called Tax Season Pop. Even iHeart has a Tax Day playlist.
Who knew tax-prep playlists were a thing?
Happy filing!
I hope you have a lovely weekend whatever you do.
Be well,
-Bryce
Note: “All dollar amounts shown here represent agency reported obligated amounts” whereas the dataset Visual Capitalist used reflects “money that is actually paid out by the government.”
Defined by the government as “Unreported amounts are calculated using the difference in the total obligated amount from the Report on Budget Execution and Budgetary Resources (excluding financing accounts) and the total obligated amount reported by agencies to USAspending.gov in 'Account Breakdown by Program Activity & Object Class' data (also called 'File B' data).”